ScadaBR
Jun
19
2012
Use ScadaBR to develop automated applications in any environment, Industries, Laboratories, Building Automation, Sanitation, Energy Systems and much more.
With several use cases in the areas of industrial process automation, distribution networks (Water & Power), and residential building automation, and various sensing applications, the ScadaBR has support for more than 20 communication protocols and is compatible with hardware hundred manufacturers throughout the world.

The ScadaBR also has layer of integration with third-party software (external), through web-services, providing solutions to integrate with MES, CEP, BI and ERP.
ScadaBR
- Communication with sensors, other PLC through OPC, Serial & Modbus TCP, ASCII, DNP3, IEC101, Bacnet etc.;
- Creating and Editing Screens (views / HMI)
- Graphics and Reporting
- Control and Data Access Controls
- Scripting
- Alarms and Events Management
- Calculate tags and points
- Web-Services API for extension in any language
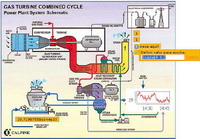
When running the application, it can be accessed from an Internet browser, preferably Firefox or Chrome. The main interface is easy ScadaBR use and already offers visualization of variables, graphs, statistics, configuration protocols, alarms, building type HMI screens and a range of options configuration.
After configuring the communication protocols with the equipment and set variables (inputs and outputs, or "tags") in an automated application, it is possible build user interfaces using the Web browser itself. It is also possible create custom applications in any modern programming language, the from the source code of their API available or "web-services".
The ScadaBR contains a small library of graphics that can be found in the folder
Monitoring points within the system can be done in two ways. It is possible using a watch list to create dynamic lists of points with their values, past update times, and graphs of historical information (if the setting point permitting). Values and graphs are updated in real time without having to refresh the browser window. Graphs of multiple points can also be displayed under demand.


